
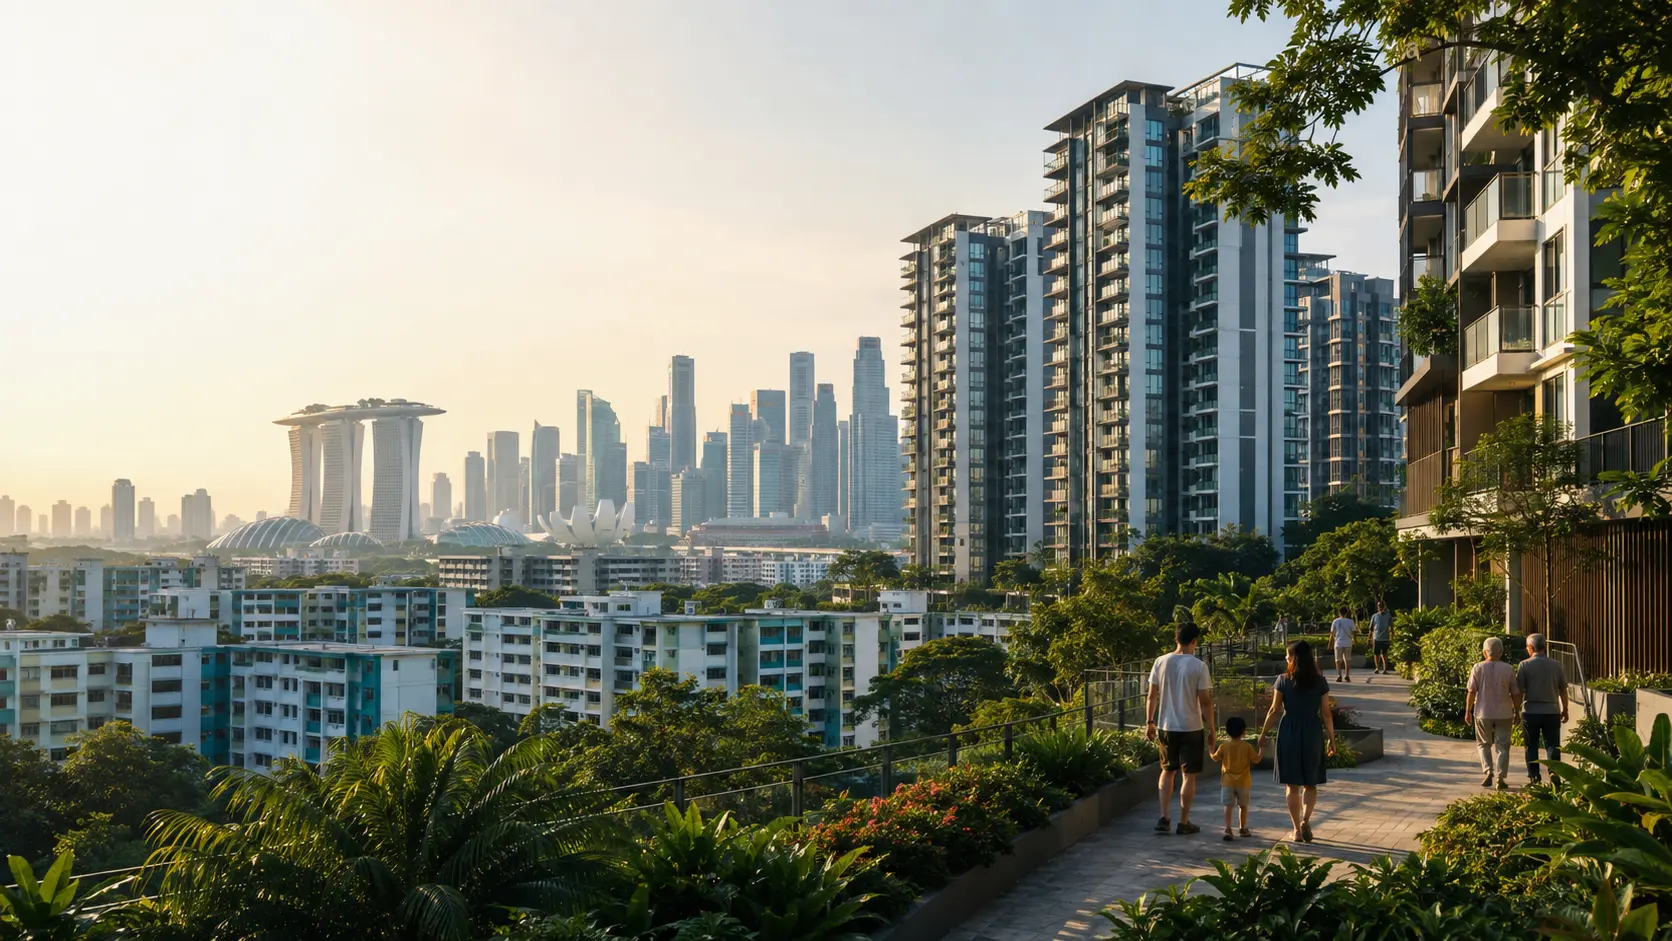
Singapore’s population rose from 5.45 million in June 2021 to 6.11 million in June 2025. That is an increase of 657,609 people. The number is real, but using it as a direct estimate of homebuyer demand produces the wrong conclusion.
The available evidence points to a resilient market led by citizens and Permanent Residents. It does not show that every additional resident needs a separate home, that every new household will buy, or that every buyer will choose a remaining new launch unit.
1. Start with the correct population breakdown
The latest official annual population data available is for June 2025. Total population increased from 5,453,566 in June 2021 to 6,111,175 in June 2025. Citizens increased by 162,492, Permanent Residents by 55,181 and nonresidents by 439,936.[1]
| Population group | June 2021 | June 2025 | Net change | Share of increase |
|---|---|---|---|---|
| Singapore citizens | 3,498,191 | 3,660,683 | 162,492 | 24.7% |
| Permanent Residents | 488,651 | 543,832 | 55,181 | 8.4% |
| Total residents | 3,986,842 | 4,204,515 | 217,673 | 33.1% |
| Nonresidents | 1,466,724 | 1,906,660 | 439,936 | 66.9% |
| Total population | 5,453,566 | 6,111,175 | 657,609 | 100% |
About two thirds of the increase came from nonresidents. The National Population and Talent Division says the recent rise was led mainly by Work Permit holders supporting construction and major infrastructure, followed by migrant domestic workers.[2] These groups require accommodation, but much of that need is met through worker housing, employer homes or rental arrangements rather than individual home purchases.
Citizen growth is not the number of new citizenship approvals
The increase of 162,492 in the citizen population is a change in population stock. It includes births, deaths, movement in and out of Singapore, returning overseas citizens and citizenship changes. It should not be described as 162,492 new citizenship approvals.
In 2024, 22,766 people were granted citizenship and 35,264 were granted Permanent Residency. The five year averages were 21,300 citizenships and 33,000 Permanent Residencies a year. Adult new citizens generally come from the existing Permanent Resident pool.[4] A status change can therefore move someone from one column to another without creating a new resident or a new household.
2. Population must pass through a housing demand funnel
A headcount is only the first stage. Every later filter reduces the number that can become effective demand for a particular project.
Official data shows resident households rising from 1,390,600 in 2021 to 1,487,100 in 2025, an increase of 96,500. Average household size fell from 3.15 to 3.06 people. One person households rose by 30,500 and two person households by 23,000.[5]
Estimated owner occupied resident households increased from 1,236,900 to 1,355,700 over the same period, while rented resident households declined from 134,800 to 121,200. The home ownership rate rose from 88.9% to 91.2%.[6]
3. Testing the one in four household assumption
Dividing the resident increase of 217,673 by the 2025 average household size of 3.06 gives about 71,100 household equivalents. Applying a one in four assumption gives about 17,800 homes.
The official household series gives a different starting point. Resident households actually increased by 96,500. Applying the same one in four assumption to that figure produces 24,125 homes. The gap appears because household size fell and household formation does not move in a fixed ratio with population.
| Method | Starting figure | One in four result | Correct interpretation |
|---|---|---|---|
| Resident increase divided by 3.06 | About 71,100 | About 17,800 | Rough sensitivity only |
| Actual increase in resident households | 96,500 | 24,125 | Still an assumed private purchase share |
| Observed new launch demand | Project caveats and developer sales | Must be measured directly | Varies by price, place, product and launch timing |
4. How many homes are bought by new citizens?
IRAS applies stamp duty treatment according to the buyer’s status and property count when the purchase occurs. A citizen buying a first residential property has no ABSD, while a Permanent Resident buying a first residential property pays 5%.[7] Once a recently naturalised citizen buys, the transaction falls within the citizen category.
Market reporting in July 2026 linked stronger luxury home demand to interest from new citizens and Permanent Residents. The report measured 353 Core Central Region transactions at S$5 million or more in the first half of 2026, up 24.7% from the same period a year earlier. It did not publish how many of those 353 purchases were made by recently naturalised citizens.[8]
This distinction protects the article from overclaiming. A market professional observing more enquiries from new citizens is useful qualitative evidence. It is not a national transaction count.
What a proper study would require
- Define a new citizen as someone who obtained citizenship within a stated period before purchase.
- Link anonymised property and citizenship records with proper privacy safeguards.
- Deduplicate joint purchasers so one home is not counted several times.
- Separate first home ownership from replacement, upgrading and investment.
- Separate new sale, resale, landed, Core Central Region, Rest of Central Region and Outside Central Region purchases.
5. What keeps property demand moving?
Property markets are driven by net housing need and gross owner movement. Net housing need adds an occupied dwelling. Owner movement occurs when an existing household sells one home and buys another. This can support several transactions without adding the same number of households.
- An older couple sells a landed home and buys a more manageable condominium.
- The landed buyer sells a large suburban condominium to fund the purchase.
- The condominium seller uses sale proceeds and financing to buy a suitable new launch.
This example creates three sale transactions while the number of households changes little.
The scale of owner movement is visible in the official figures. During 2025, developers sold 10,815 private homes excluding ECs, while 14,622 resale transactions and 1,055 subsale transactions were recorded.[9] These are gross transactions, not newly formed households.
MND also reported that the stock of owner occupied private residential properties rose by about 27,000 units from 2020 to 2024, compared with about 8,000 for properties that were not owner occupied. MND linked the stronger owner occupation growth partly to measures that prioritised genuine owner occupation.[10]
| Demand channel | How it creates a purchase | Does it add net housing need? | Main limitation |
|---|---|---|---|
| New household or first home buyer | Moves from a family home or rental into ownership | Often yes | May choose BTO, HDB resale, EC or private resale |
| HDB upgrader | Sells an HDB flat and buys private housing | Usually changes tenure | Must bridge equity, cash, CPF, loan and monthly repayment needs |
| Private home right sizer | Sells landed or a large condominium and buys a smaller home | Usually no | May choose private resale or HDB instead of a new launch |
| Collective sale owner | Uses collective sale proceeds to secure a replacement home | Replaces an existing home | Demand is cyclical and depends on successful collective sales |
| Permanent Resident or new citizen | Moves from rental, replaces a home or changes market segment | Only when another occupied home is required | Recent naturalisation is not separately shown in public purchase data |
| Investment buyer | Adds a rental or wealth holding property | May add rental supply | ABSD, financing and yield constrain the decision |
Right sizing is visible, but address data has limits
For Singaporeans who bought new Core Central Region homes in 2026 up to mid July, an industry analysis reported that 55.8% had a private residential address and 16.1% had an HDB address. This is consistent with possible right sizing and upgrading.[11] A registered address does not prove ownership, a sale, or the size of the previous home. It is an indicator, not a complete buyer history.
The removal of the fifteen month wait period from 27 July 2026 also allows eligible private property owners to buy nonsubsidised HDB resale flats without that temporary restriction, subject to the prevailing conditions.[12] This reinforces the two way nature of owner movement. Some right sizers support private condominiums while others leave private housing for HDB resale.
Collective sale demand is powerful but cyclical
Collective sale owners often need replacement homes and may have substantial sale proceeds. Yet this is not a steady annual demand floor. Industry research recorded collective sale values of S$8.7 billion in 2017 and S$10.8 billion in 2018, while the strongest year from 2021 to 2025 was S$3.6 billion in 2022.[13] These owners can create a strong demand wave, but the timing changes with developer appetite, land prices and successful tenders.
6. Correcting the foreign buyer comparison
Knight Frank analysis reported by The Business Times found that foreigners bought 1,216 nonlanded private homes in 2018, equal to 6.3% of islandwide nonlanded purchases. Foreign participation was higher within the Core Central Region, but even there it varied by sale type and period.[14]
For a much narrower segment, industry analysis of URA caveats reported that 2025 buyers of new nonlanded homes in the Core Central Region were about 82% citizens, about 15% Permanent Residents and 3.1% foreigners. New sales in that segment rose to 1,916 units. The same research put the average foreign share of new Core Central Region purchases at 17% from 2015 to 2022, 10.7% in 2024 and 4.7% in 2026 up to mid July.[11]
The 2018 islandwide figure and the 2025 Core Central Region new sale figure are not a clean comparison. Geography, property type, sale type, buyer definition and period must match before a trend is claimed.
IRAS confirms that foreigner ABSD rose from 30% to 60% for purchases on or after 27 April 2023.[7] This sharply reduced foreign participation, but it does not prove that new citizens alone filled the gap. Citizens, Permanent Residents, existing private owners, HDB upgraders, right sizers and collective sale owners all contribute.
7. Affordability converts potential demand into effective demand
A household may need a home and still be unable or unwilling to buy a particular new launch. The binding constraint is often total price quantum, not price per square foot alone.
This example explains why 96,500 additional resident households cannot simply be matched against private new launch inventory. Most households do not fall within the income, liquidity, life stage and location profile for a S$2 million purchase.
Remaining stock is not one interchangeable block
At the end of the second quarter of 2026, URA reported 42,472 private residential units including ECs in the pipeline with planning approval. Of these, 15,810 were unsold. Another 18,153 unsold units had not yet received planning approval. These numbers include future supply and do not represent completed homes ready for occupation.[17]
A compact unit near an MRT station at a manageable quantum does not compete perfectly with a large prime unit, a distant family home or a project completing several years later. The available household count can exceed unsold inventory while some units remain slow because the buyers and the stock do not match.
8. What consumers are doing now
Second quarter 2026 data shows a selective market. Overall private residential prices rose 0.5%, but landed prices gained 2.5% while nonlanded prices eased 0.1%. Core Central Region nonlanded prices rose 1.8%, Rest of Central Region prices fell 1.2% and Outside Central Region prices eased 0.1%.[17]
Developers launched 1,783 units and sold 2,141 during the quarter because buyers also selected stock from earlier launches. Resale recorded 3,813 transactions and represented 62% of all private sale transactions. Vacancy increased to 6.4%.[17]
Four consumer behaviours stand out:
- Quantum comes first. Buyers are testing total cash, CPF, stamp duty, instalment and emergency reserves before accepting a price per square foot story.
- New launch is compared with resale. Immediate occupation, visible condition, established surroundings and usable space remain strong resale advantages.
- Local owner movement matters. HDB upgraders, private home right sizers, landed sellers and collective sale owners can keep sales active without equal net household growth.
- Location and layout are decisive. Buyers do not absorb national inventory evenly. They choose a specific home for family, work, school, transport, retirement or rental reasons.
The balanced conclusion
Singapore housing demand is supported by structural household growth and by existing owners moving through the market. New citizens are plausibly one part of that demand, but public data does not show a national purchase count for recently naturalised citizens.
Foreign participation has fallen sharply in several private market segments while citizens and Permanent Residents have become more prominent. That supports local market resilience. It does not make every project equally suitable, affordable or easy to absorb.
Test your numbers before choosing the property
Share your objective, current property position, approximate budget and preferred timeline. The first step is a structured clarity review, not a sales commitment.
Cash, CPF, loan, stamp duty and holding comfort
Location, space, tenure, timing and family needs
Future buyer pool, competing supply and flexibility
No sensitive documents are needed for the initial enquiry. Sending an enquiry does not appoint UProperty.sg, Andrew Koh, OrangeTee & Tie or any salesperson as your property agent. Any formal estate agency engagement must be separately agreed and documented.
Frequently asked questions
Does 650,000 more people mean 650,000 more homebuyers?
No. About two thirds of the increase came from nonresidents, while resident growth must still translate into separate households, a tenure choice, financial capacity and a suitable property.
How many homes were bought by recently naturalised citizens?
No defensible public national count was identified. Public transaction profiles record citizenship status when a purchase occurs but do not show when citizenship was obtained.
Why can demand remain active if household growth is lower?
Existing owners sell and buy another home. A landed seller, condominium seller and upgrader can form a linked transaction chain without creating three new households.
What decides whether remaining new launch stock will sell?
Price quantum, cash and CPF capacity, financing, location, unit size, household need, completion timing and competing supply are more decisive than national population alone.
References and methodology
- Singapore Department of Statistics, Indicators on Population, Annual.
- National Population and Talent Division, Overall Population.
- National Population and Talent Division, Population in Brief 2021.
- National Population and Talent Division, People and Society.
- Singapore Department of Statistics, Resident Households by Household Size.
- Singapore Department of Statistics, Resident Households by Tenancy.
- Inland Revenue Authority of Singapore, Additional Buyer’s Stamp Duty.
- The Business Times, New citizens and Permanent Residents in luxury home demand, 13 July 2026.
- Urban Redevelopment Authority, Fourth Quarter 2025 Real Estate Statistics.
- Ministry of National Development, owner occupied and investment private properties, 4 February 2025.
- Huttons Asia analysis using URA caveats, Core Central Region buyer profile, July 2026.
- Housing and Development Board, removal of the fifteen month wait period, 27 July 2026.
- ERA Research, Singapore collective sale market, June 2026.
- The Business Times and Knight Frank, foreign purchases of Singapore nonlanded homes, 21 February 2024.
- Monetary Authority of Singapore, calculating TDSR for property loans.
- Monetary Authority of Singapore, loan tenure and loan to value limits; and IRAS, Buyer’s Stamp Duty.
- Urban Redevelopment Authority, Second Quarter 2026 Real Estate Statistics, 24 July 2026.
- Council for Estate Agencies, professional guidance and ethical advertising.
- Council for Estate Agencies, verify a property agent.
Method note: population and household figures use official annual estimates. Transaction figures count sales rather than unique households. Caveat based buyer profiles can omit transactions where no caveat is lodged and do not establish previous ownership, citizenship acquisition date or purchase purpose. Market observations are clearly separated from official statistics and scenario assumptions.
This article provides general information and market commentary. It is not legal, tax, CPF, financial, lending, valuation, immigration or investment advice. It does not promise price growth, rental yield, loan approval, eligibility, project availability, transaction success or any other outcome. Rules, rates, project information and market conditions can change. Verify material matters with the relevant authority, lender, developer, lawyer or qualified professional before acting.
Editorial status: First published and last reviewed on 18 August 2026. Category: Singapore Property Market. Article tags: Singapore population, housing demand, new launch condos, resident households, new citizens, foreign buyers, property affordability, right sizing and collective sales.